
CO2 EMISSIONS PER COUNTRY
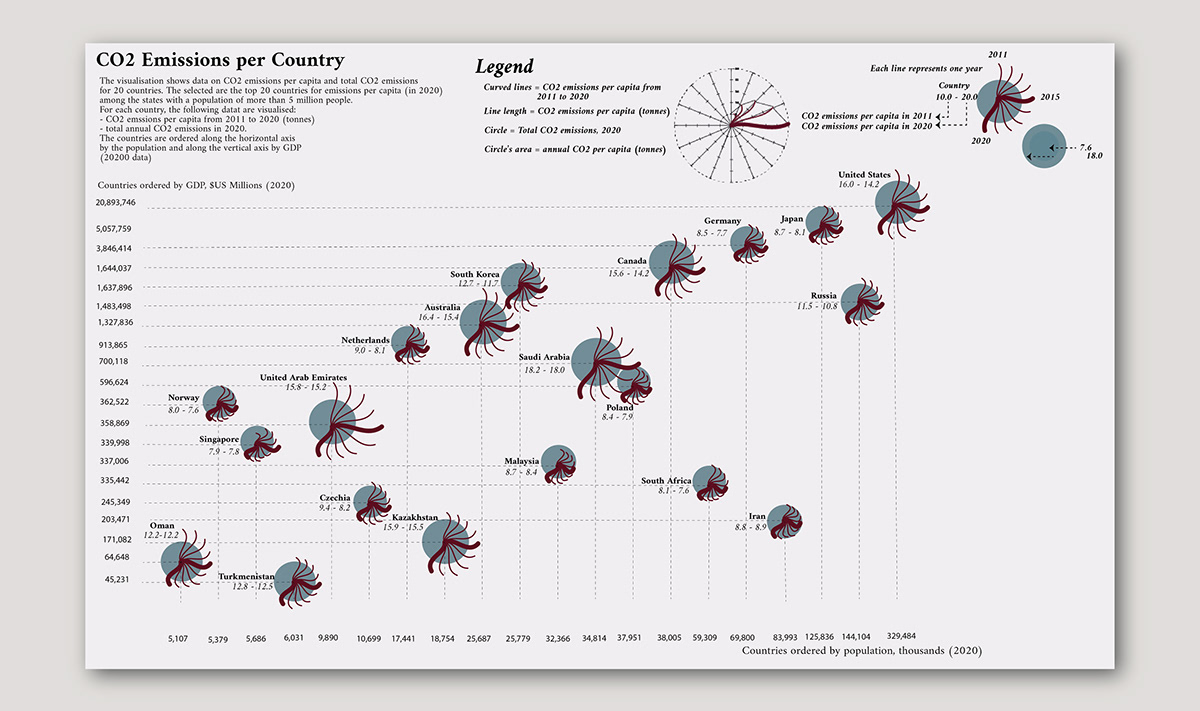
A data visualisation exhibiting global carbon dioxide emissions from years 2011 to 2020. Data was collected, analysed and visualised to narrate a data story surrounding the carbon usage by the top 20 countries with the most carbon emissions in 2020.
by Geetha Kanniah; this data visualisation was my first infographic created


